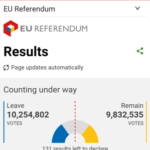
Oh my god, UK what have you done? I thought the Brexit vote may be close but not in favour of leaving the EU.
I must say I have never lived in the UK, and, myself, my parents and grandparents were not born there NOR do I usually have an interest in politics (altough this is changing the older I get) BUT I did really get into watching the result of the UK referendum today.
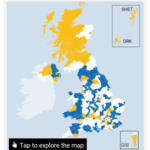
I think this was in part due to the great use of data visualisations to reveal the referendum results. I mainly stuck to the BBC website but The Guardian also had great infographics (and more details by demographics). As a visual person it was much easier to see the result as colours on a map and colours on a half circle than words and numbers alone. Watching the map of the UK change from white to blue and yellow had me glued to my computer for the day.
I hope we continue to see data visualisation used to document the results of elections and referendums in the future. It certainly makes politics more interesting to me.

